
Home / Monitoring / Server monitoring

SERVER MONITORING
Server monitoring.
OS to hardware.
Monitor Windows and Linux servers with the MonitorCTL collector agent. Add server hardware monitoring through HPE iLO, IPMI and Dell iDRAC to see more of the systems your services depend on.
Monitor types, intervals, and advanced options vary by plan.
BUILT FOR DAY-TO-DAY OPERATIONS
Understand the server behind the service.
01
See inside the operating system.
Use the collector agent on supported Windows and Linux servers to bring system health and resource metrics into your monitoring workspace.
02
Keep hardware health in view.
Add the server’s management controller to monitor supported hardware health readings alongside the operating system.
03
Connect the signs of a problem.
Review current status, metric history and incidents together. Give the team responsible a clearer starting point for investigation.
COLLECTOR AGENT
Windows and Linux server monitoring.
Connect each supported operating system with the MonitorCTL collector agent. Keep the readings that matter to your team together with their status and alert history.
Windows server monitoring
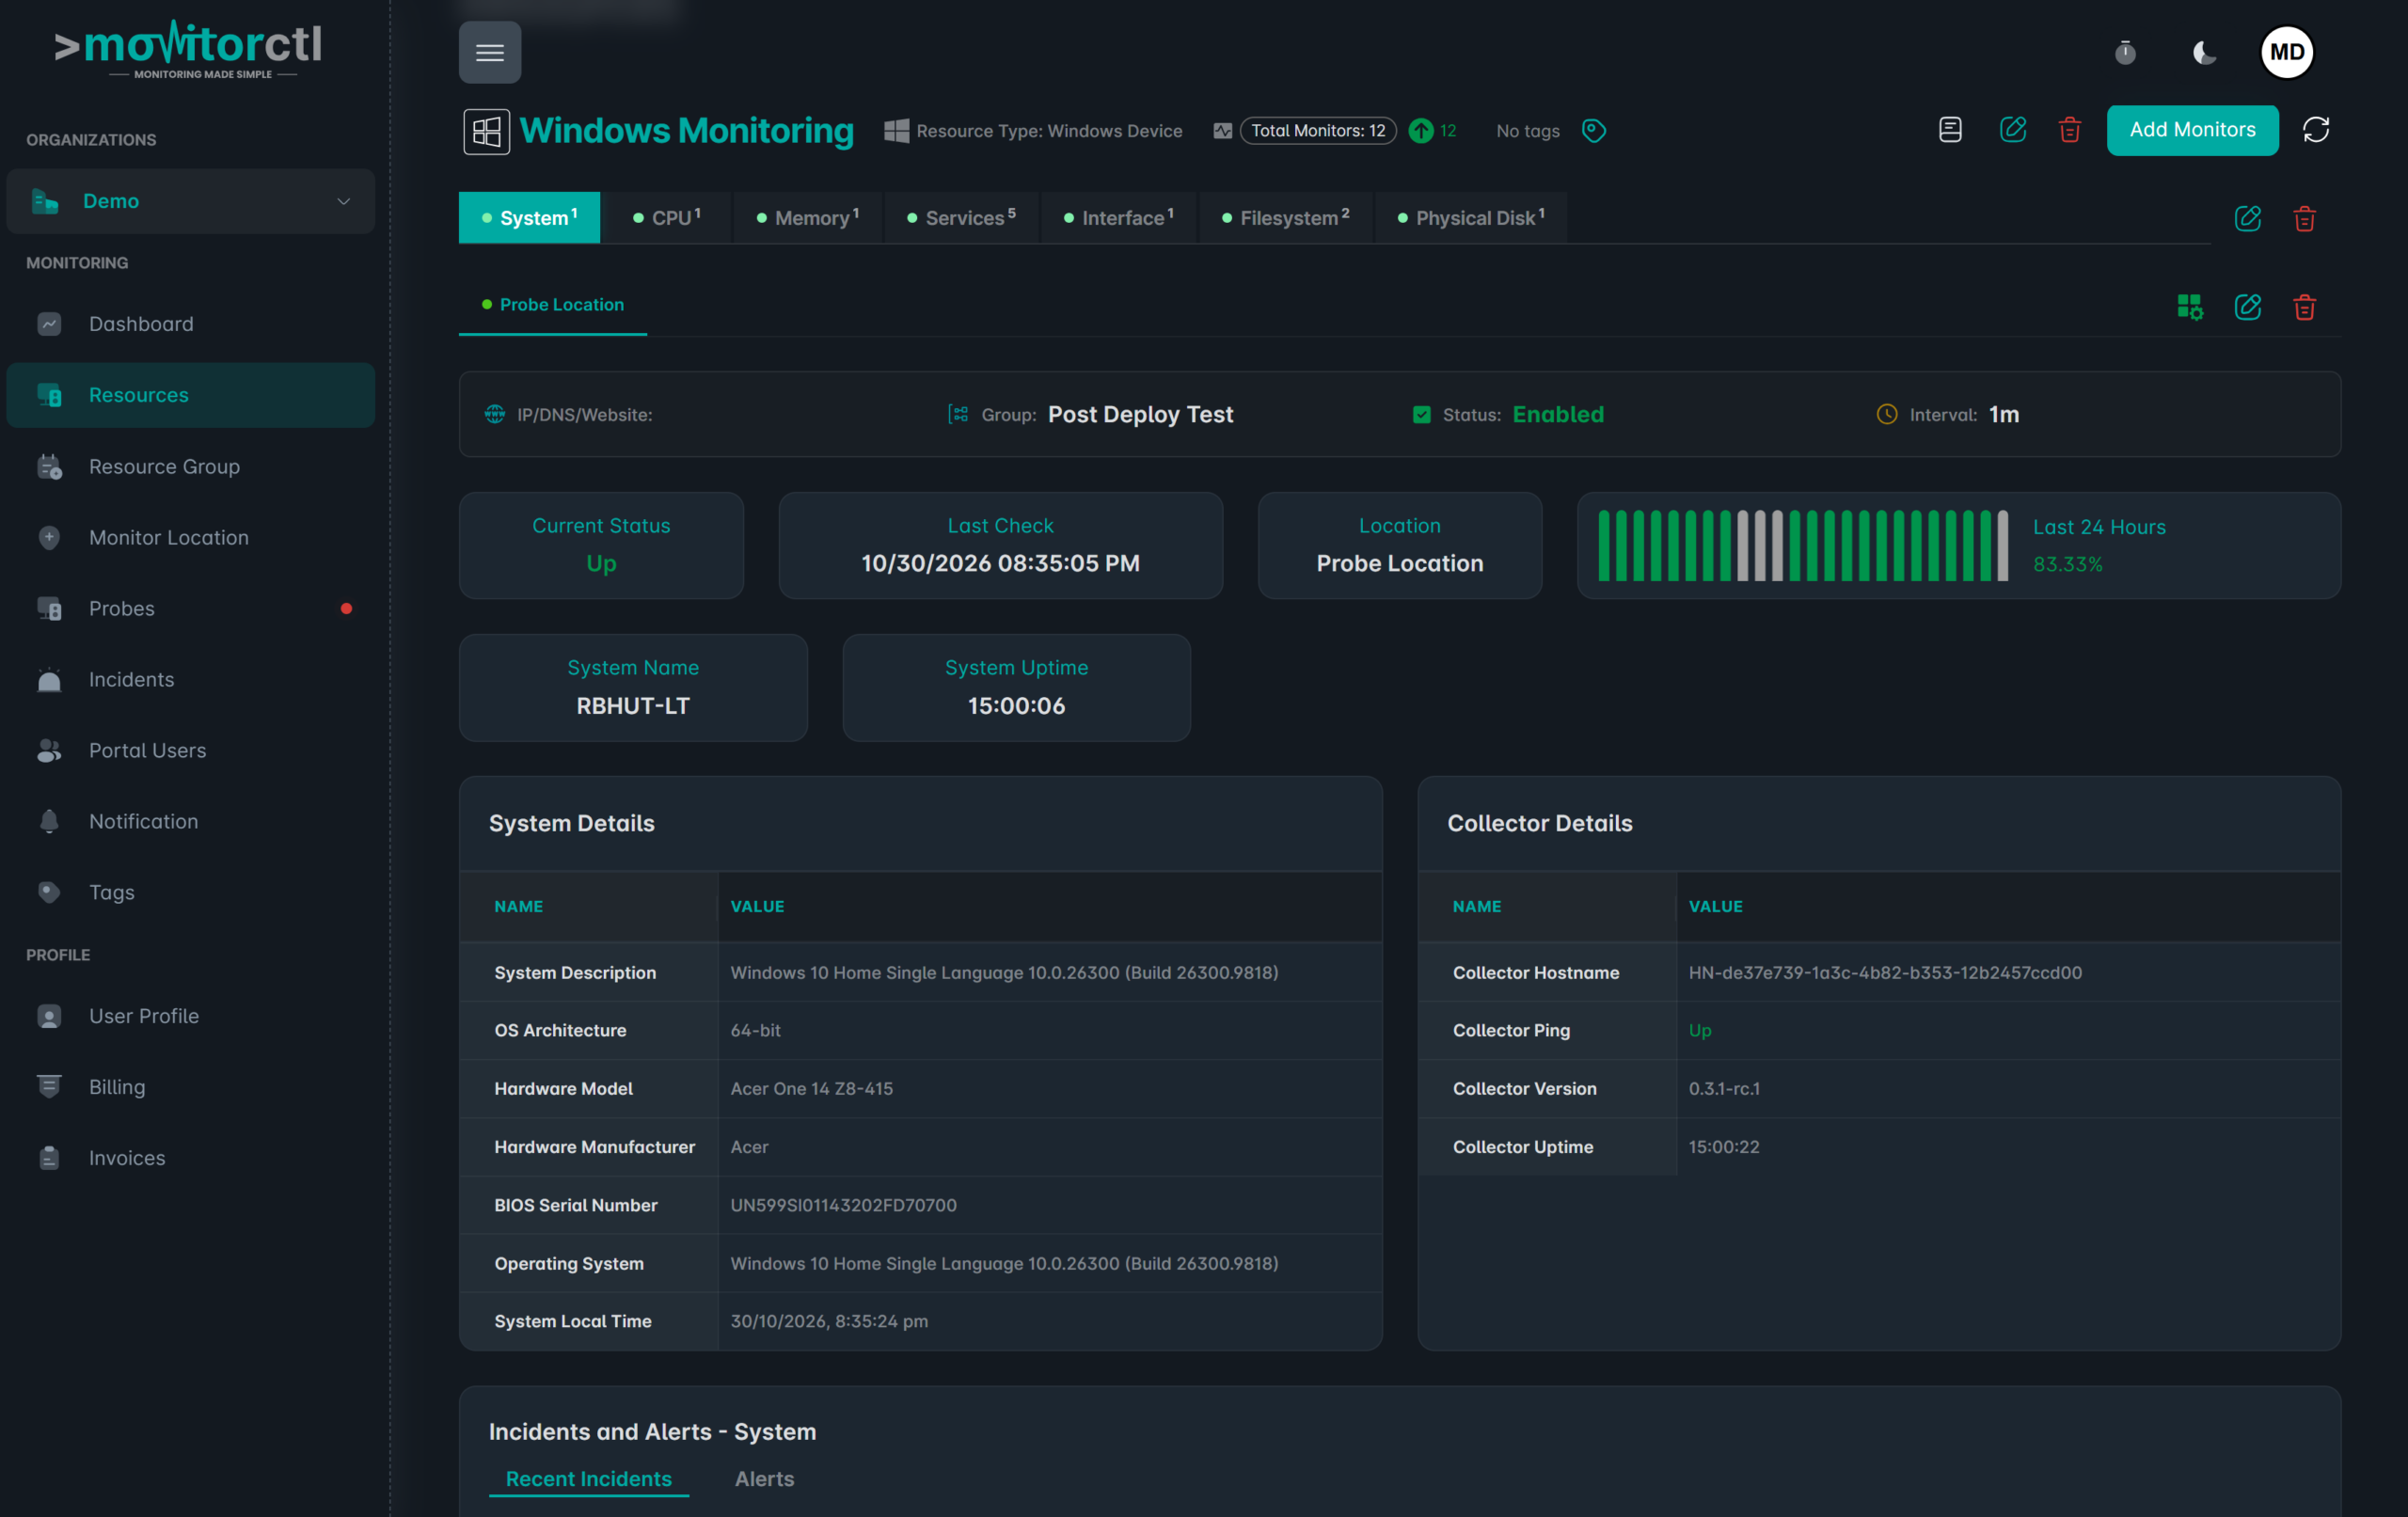
Use the collector agent to monitor your Windows environment. Review system details and configured CPU, memory, service, interface and disk monitors.
Useful for following resource usage and investigating stopped Windows services.
Linux server monitoring
Use the collector agent to bring supported Linux operating-system health and resource metrics into MonitorCTL. Configure the monitors relevant to each workload.
Available metrics depend on the supported Linux environment and collector configuration.
ILO · IPMI · IDRAC
Monitor the hardware behind the operating system.
Add a complementary view through the server management controller. Review supported sensor and component health readings alongside your operating-system monitoring.
HPE iLO monitoring
Monitor supported HPE server hardware through Integrated Lights-Out (iLO). Bring available controller health readings into your server monitoring workflow.
HPE server management controller
IPMI monitoring
Monitor hardware on compatible servers through the Intelligent Platform Management Interface (IPMI). Follow the sensor readings exposed by the management controller.
Hardware management interface
Dell iDRAC monitoring
Monitor supported Dell PowerEdge server hardware through the Integrated Dell Remote Access Controller (iDRAC). Keep available component health in view.
Dell server management controller
Available readings can include temperature, fans, power supplies and component health. Sensor coverage varies by server model, controller, firmware and configuration.
Explore the MonitorCTL resource workspace.
See how resources are organized in MonitorCTL. This general workspace walkthrough complements the Windows example above; available views depend on the resource and configured monitors.
WHERE IT HELPS
From a single server
to a mixed environment.
Choose the monitoring layer that fits each system. A virtual machine needs an operating-system view; a physical host can also benefit from independent hardware health checks.
Connect server health with network monitoring and TCP port checks. These checks help distinguish a reachable host from an available service and a healthy server.
Windows and Linux workloads
Follow important servers across both operating systems with a consistent monitoring and notification workflow.
Physical server fleets
Bring supported HPE iLO, Dell iDRAC and IPMI hardware health into view across the servers your team maintains.
Incident investigation
Check whether an alert relates to the operating system, a service or an available hardware sensor before deciding the next step.
FROM CONFIGURATION TO CONTEXT
Connect the OS. Add the hardware view.
01 / SETUP
Connect the collector agent
Install and configure the MonitorCTL collector agent on a supported Windows or Linux server, then confirm that its readings appear.
02 / SETUP
Add hardware monitoring
For physical servers, configure the supported iLO, iDRAC or IPMI monitoring connection and verify the available health readings.
03 / SETUP
Set alerts and ownership
Choose relevant monitors, thresholds and notification channels. Assign the people who will review alerts and maintain the server.

KEEP THE RIGHT PEOPLE INFORMED
Bring alerts into your team’s workflow.
Choose email or supported integrations such as Slack, Microsoft Teams, and webhooks. Use maintenance windows for planned work and acknowledgements or comments to add incident context.
Notification channels and workflow features depend on your plan.
A FEW USEFUL ANSWERS
Answers for your
monitoring plan.
How are Windows and Linux servers monitored?
MonitorCTL uses a collector agent on supported Windows and Linux servers to collect operating-system monitoring data. Available metrics and setup requirements depend on the operating system and collector configuration.
What is the difference between the collector and hardware monitoring?
The collector runs inside the operating system. Hardware monitoring reads the supported health information exposed by the server’s management controller. These views complement one another; a hardware health check does not replace monitoring the operating system.
Which server hardware interfaces can I monitor?
MonitorCTL supports server hardware monitoring through HPE iLO, Dell iDRAC and IPMI. IPMI is a management interface supported by many server platforms; iLO and iDRAC are vendor management controllers. Available readings depend on the server model, controller, firmware and configuration.
Can hardware monitoring help when the operating system is unavailable?
A server’s management controller can provide a separate hardware view when the host operating system is unavailable, provided the controller remains powered, reachable and correctly configured. The collector’s operating-system readings depend on the host and collector being available.
BUILD A MORE COMPLETE VIEW
The next useful signal.

Enterprise monitoring
Private infrastructure
SNMP monitoring
Device health & performance

TCP port monitoring
Service connectivity
Bring your servers
into one clear view.
Tell us about your Windows, Linux and physical server environment. We can help you plan collector deployment and review the hardware monitoring options that fit.
Website and infrastructure monitoring.
A clearer view of what matters.
A clearer view of what matters.