
Home / Monitoring / SNMP monitoring

SNMP MONITORING
SNMP network
monitoring.
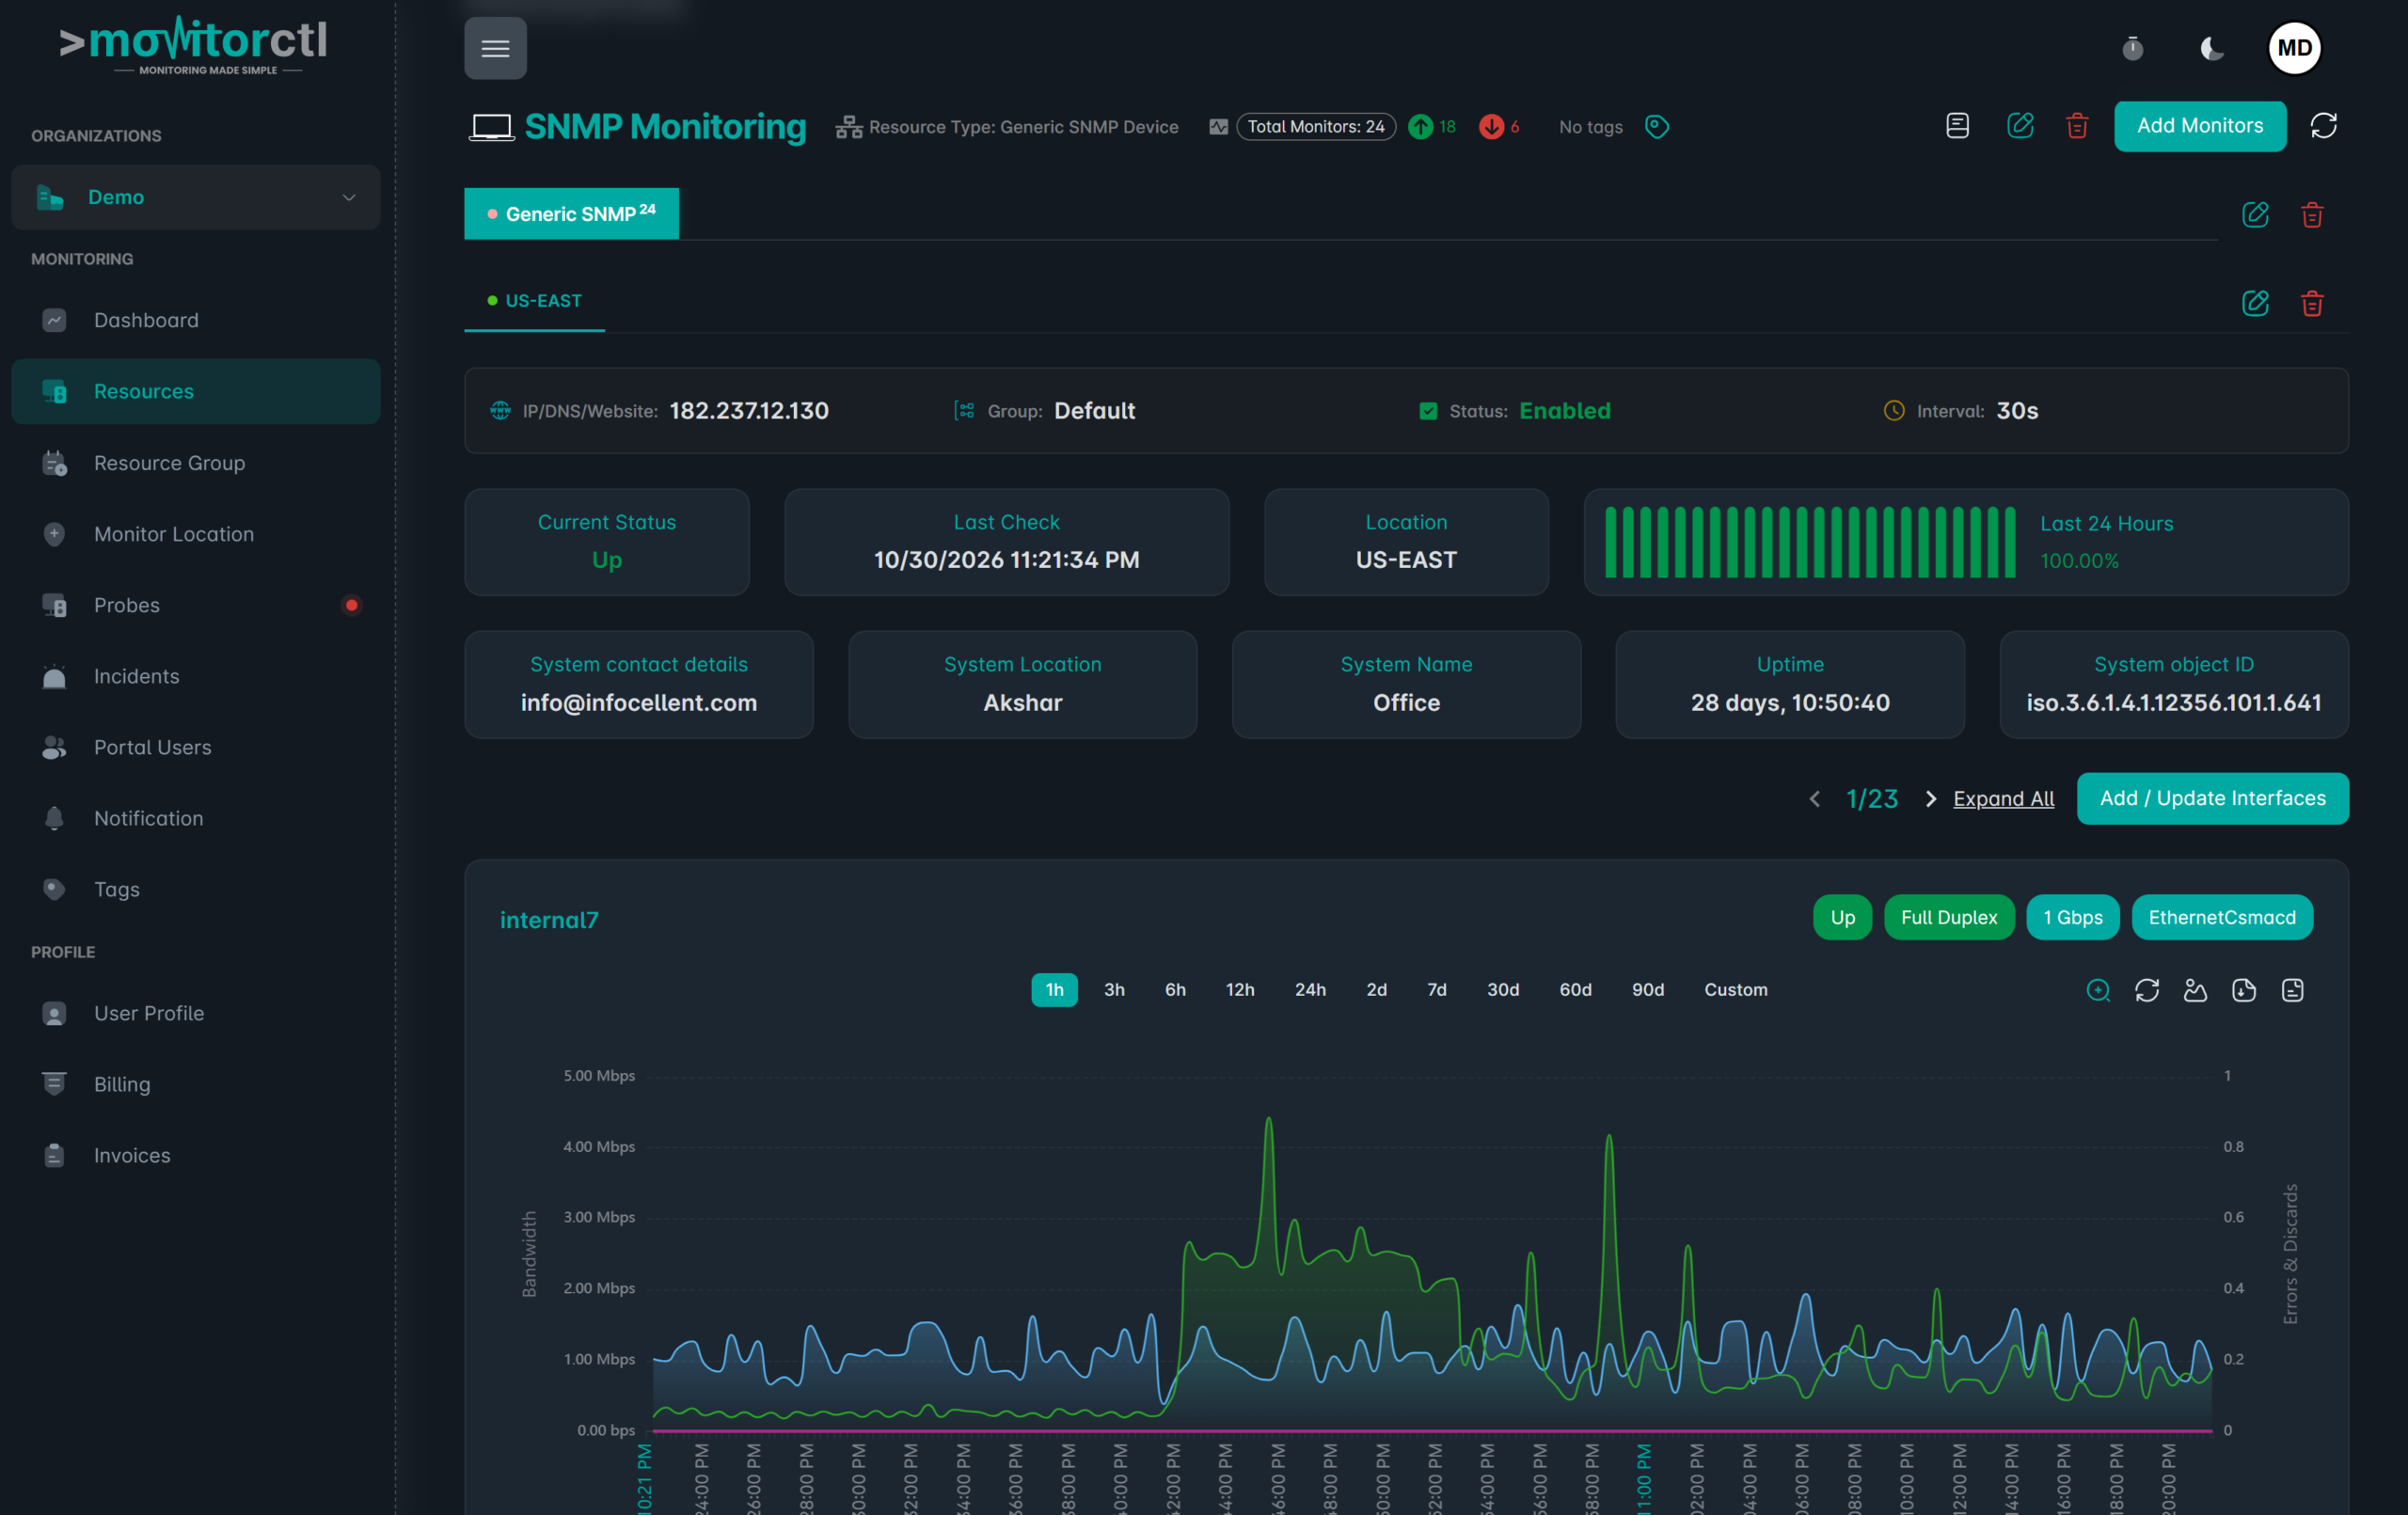
Collect supported network device and interface metrics with SNMP v2/v3 monitoring. Follow bandwidth usage, CPU, memory, and interface status to investigate performance across your infrastructure.
Monitor types, intervals, and advanced options vary by plan.
BUILT FOR DAY-TO-DAY OPERATIONS
Turn device metrics into operational context.
01
Look inside the device.
Track supported health and performance metrics from routers, switches, firewalls, and servers that expose SNMP data.
02
See interface behavior.
Follow interface status and bandwidth usage to investigate connectivity, congestion, and changes in traffic patterns.
03
Use thresholds and trends.
Receive notifications when configured thresholds are exceeded and compare current readings with historical graphs.
Explore your monitoring resources.
Watch a walkthrough of the MonitorCTL workspace. Use the player controls to pause or view it full screen.
WHERE IT HELPS
A deeper view than
reachability alone.
A device can remain online while its resources or interfaces are under pressure. SNMP metrics add performance context to ping and service-connectivity checks.
Connect device metrics to your wider network monitoring workflow. Add internet link monitoring for connectivity or ping checks for reachability.
Core network devices
Observe health and interface metrics on supported routers, switches, and firewalls.
Capacity planning
Use resource and traffic history to inform reviews of recurring load.
Fault investigations
Compare device metrics with the timing of alerts and reported service issues.
FROM CONFIGURATION TO CONTEXT
Make the first check count.
01 / SETUP
Prepare the device
Enable authorized SNMP access and choose the supported protocol version.
02 / SETUP
Connect monitoring
Configure the probe or monitoring path, device credentials, and available metrics.
03 / SETUP
Tune the workflow
Set useful thresholds and notification channels, then review trends with your team.

KEEP THE RIGHT PEOPLE INFORMED
Bring alerts into your team’s workflow.
Choose email or supported integrations such as Slack, Microsoft Teams, and webhooks. Use maintenance windows for planned work and acknowledgements or comments to add incident context.
Notification channels and workflow features depend on your plan.
A FEW USEFUL ANSWERS
Know what your
check tells you.
Does MonitorCTL support SNMP v3?
Yes. The current SNMP service lists v2 and v3 support. Use the version and access configuration appropriate to your device and environment.
Are the same metrics available on every device?
No. Available measurements depend on what the device exposes and the monitor’s supported configuration. Confirm the required metrics during setup.
Can I track interface bandwidth?
MonitorCTL describes bandwidth and interface metrics through SNMP. Internet link monitoring provides a related view focused on WAN connectivity and utilization.
What is needed for private devices?
A private probe and appropriate network and device access are required for internal targets. Review deployment requirements and supported monitor options before rollout.
BUILD A MORE COMPLETE VIEW
The next useful signal.

Internet link monitoring
WAN & connectivity

Enterprise monitoring
Private infrastructure

Ping monitoring
Reachability & latency
Bring device performance
into the conversation.
Choose the monitoring that fits your environment. Start with a free account, or talk with us about your infrastructure.
Website and infrastructure monitoring.
A clearer view of what matters.
A clearer view of what matters.